As a product designer on a cross-functional team, I led the UX research and design of a dashboard connecting multiple social media accounts, improving how marketing teams and business owners monitor, analyze, and share user insights
Most large and medium-sized companies have active social networking accounts with different online platforms. Due to challenges that the users have encountered, such as using multiple tools to observe and analyze multiple social media accounts. They wasted a lot of time getting started and gathering information from various places. Instead of spending time to analyze target users and plan marketing strategies. There should be a right tool that allows users to consolidate all social media accounts of a company into a social media dashboard.
Unable to directly engage customers per the sales contract, so I conducted user research via the Customer Success Team, which closely interacts with clients. Leveraging their insights, to ensure a customer-centric approach, gathering feedback and opinions during user testing.
Despite being over a decade old, we still employ the initial encryption technology in select products. As a designer, I must grasp its limitations; it can't deliver intricate results. Thus, I factored this in, simplifying the UI in areas utilizing this older tech.
I planned and conducted user interviews to understand and empathize with target users to achieve user-centered solutions. Here’s what some of the users said when asked about monitoring data from social media accounts in one dashboard.
Users would like to hear what the target market think about a company and its products in real time.
The data should be displayed into a visual format that is easy to understand and used for further analysis.
Options offered to customize the dashboard based on what relevant information the user wants to monitor and how often.
Users are looking for a way to export the insights in the preferred format with the teams for the marketing strategies.
Allows users to share a dashboard and connect with team members to work on the same audits.
The user interface must be clear and the dashboard is easy to use and navigate.
After analyzing user needs, there is an opportunity to create a dashboard that consolidate multiple social media account that will meet all user expectations.
Create a dashboard for marketing team and business owner which focus on tracking and analyzing social media accounts, so that they have the insights from target users to further plan on product and marketing strategies.
One of the main tasks of the marketing team is to keep an eye on company’s social media accounts and collect related data for market analysis. Including sharing those data between team members in order to plan marketing strategies in the next steps.
"As a senior market researcher, I want to gather all market data from multiple social media accounts so that I have all related data in a single place to further analyze and share with the team."
After creating the user flow, I started sketching ideas that convey user needs regarding functionalities into a dashboard. I designed several versions, shown below are the selected ones for which I based my wireframes on.
I translated the selected sketches into the low-fidelity wireframes and then created low-fidelity prototypes.
I used the low fidelity prototypes to conduct the usability testing. This helps me test out the initial ideas of the product and find out any issues. Here's the improvement points that users shared during the test.
After the usability test, I got helpful feedback and then iterated design based on it. The first change is now users are able to configure the frequency of data refresh for each section.
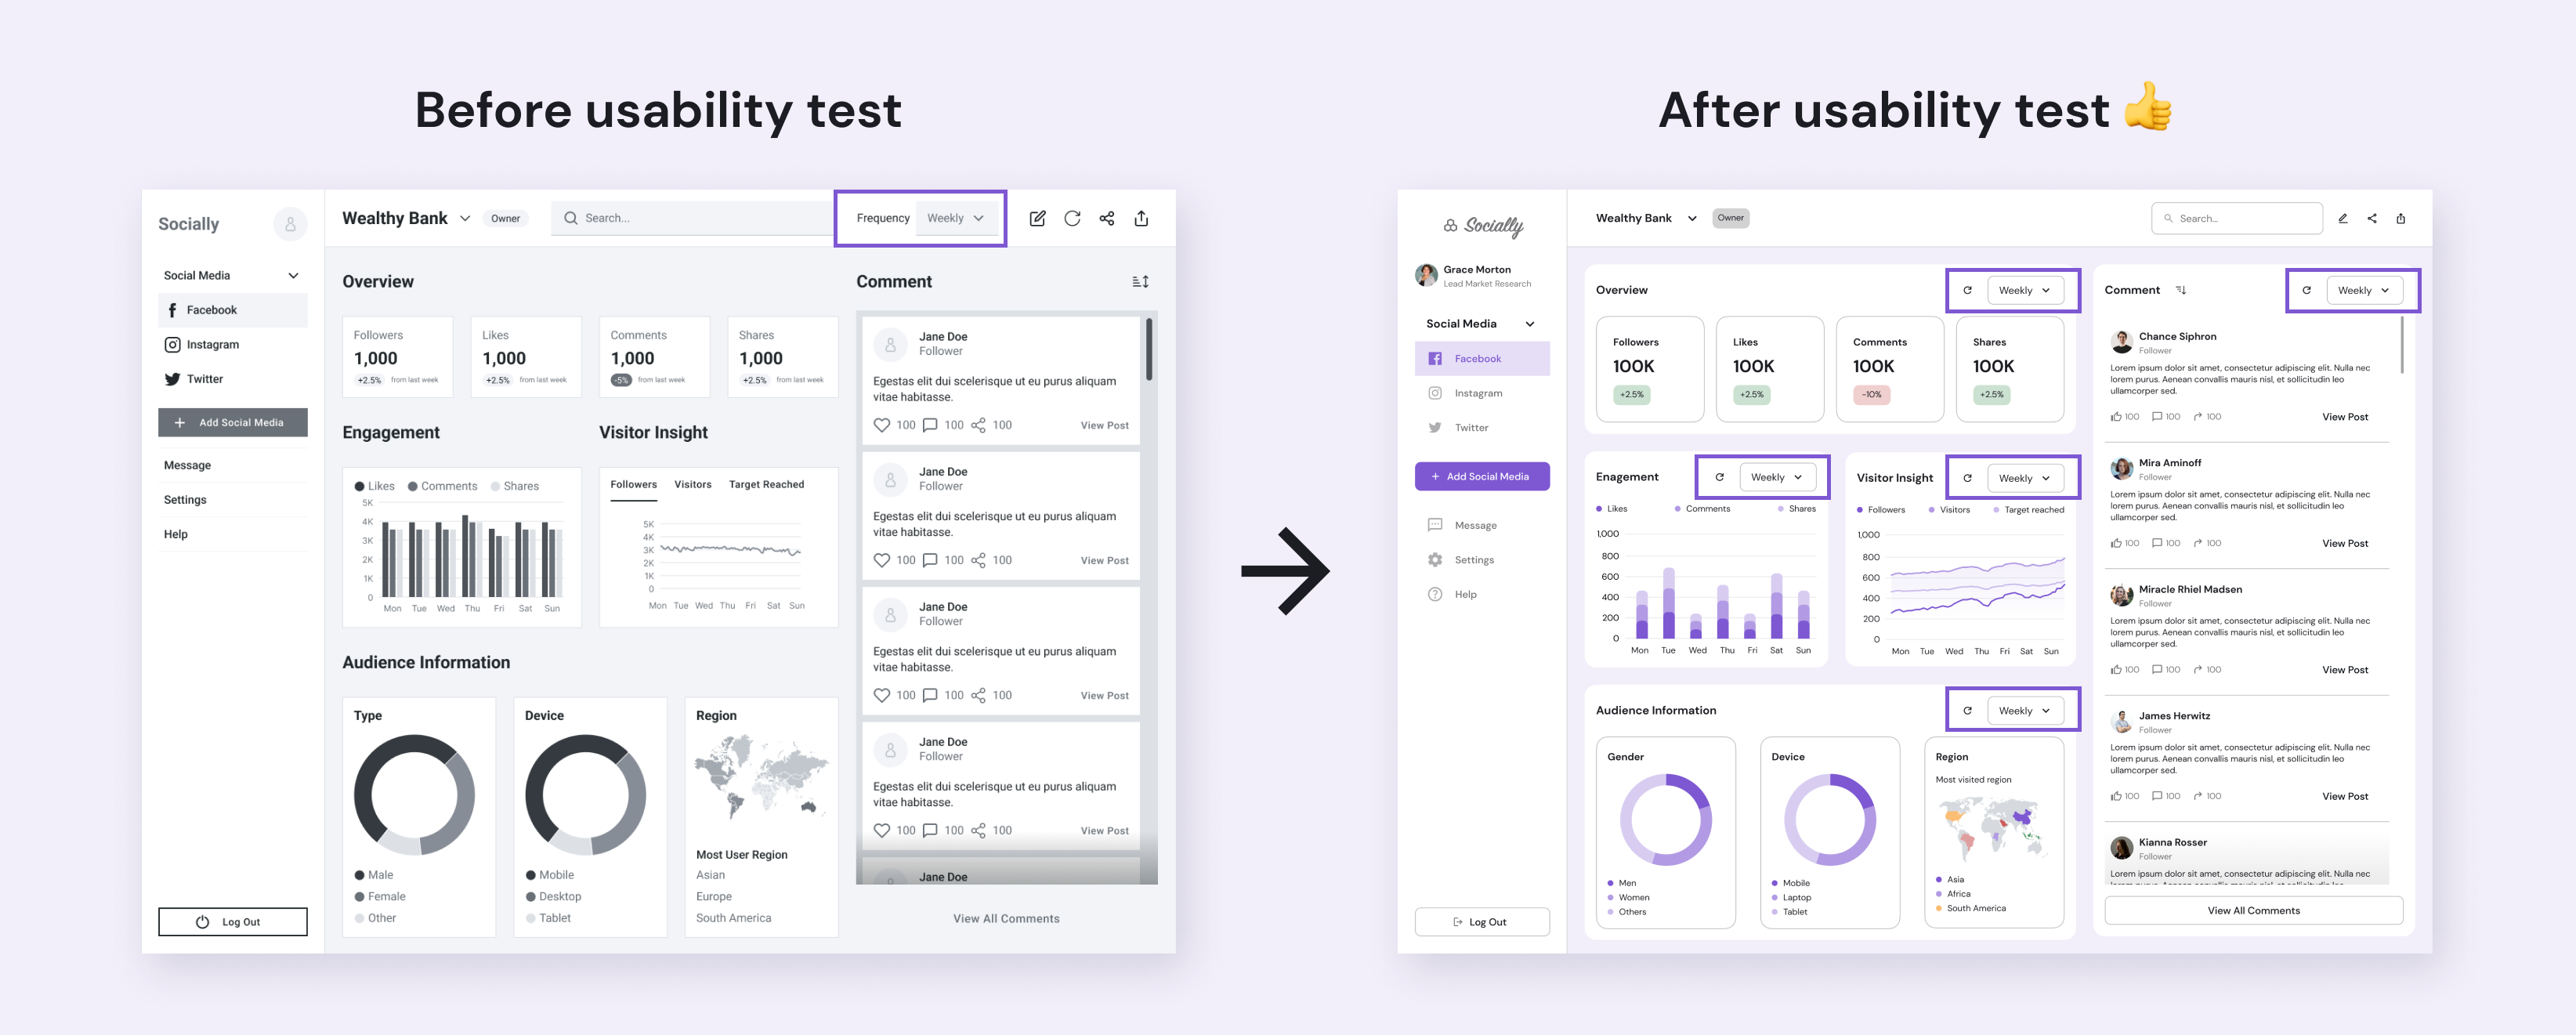
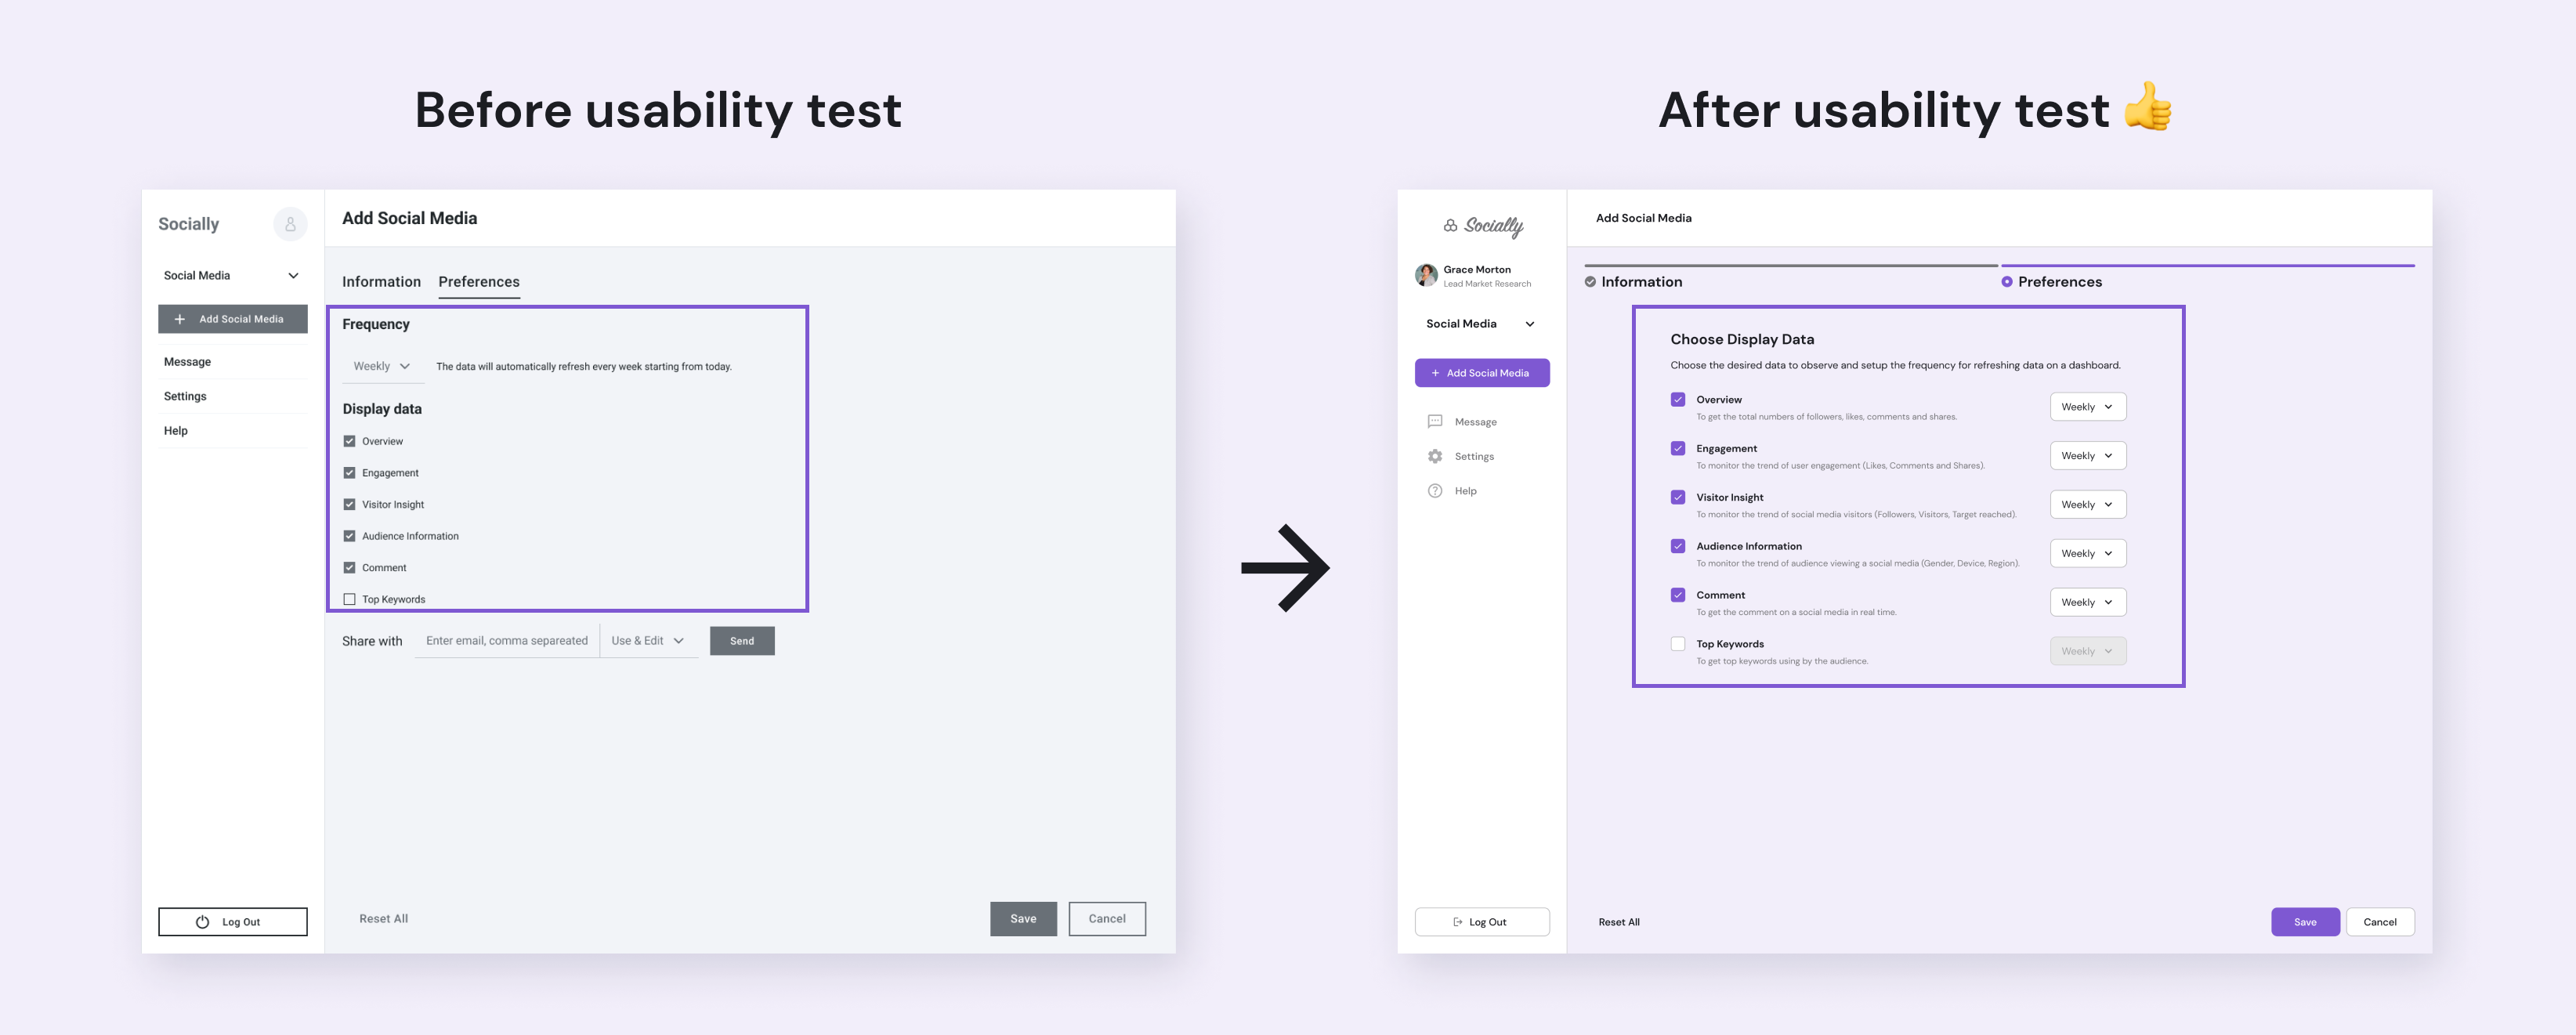
I added more descriptions for each configuration in the setup wizard. So, users will have more guidance and can proceed to the next steps. There is also the change of frequency setting, users will be able to set frequency values for each section.
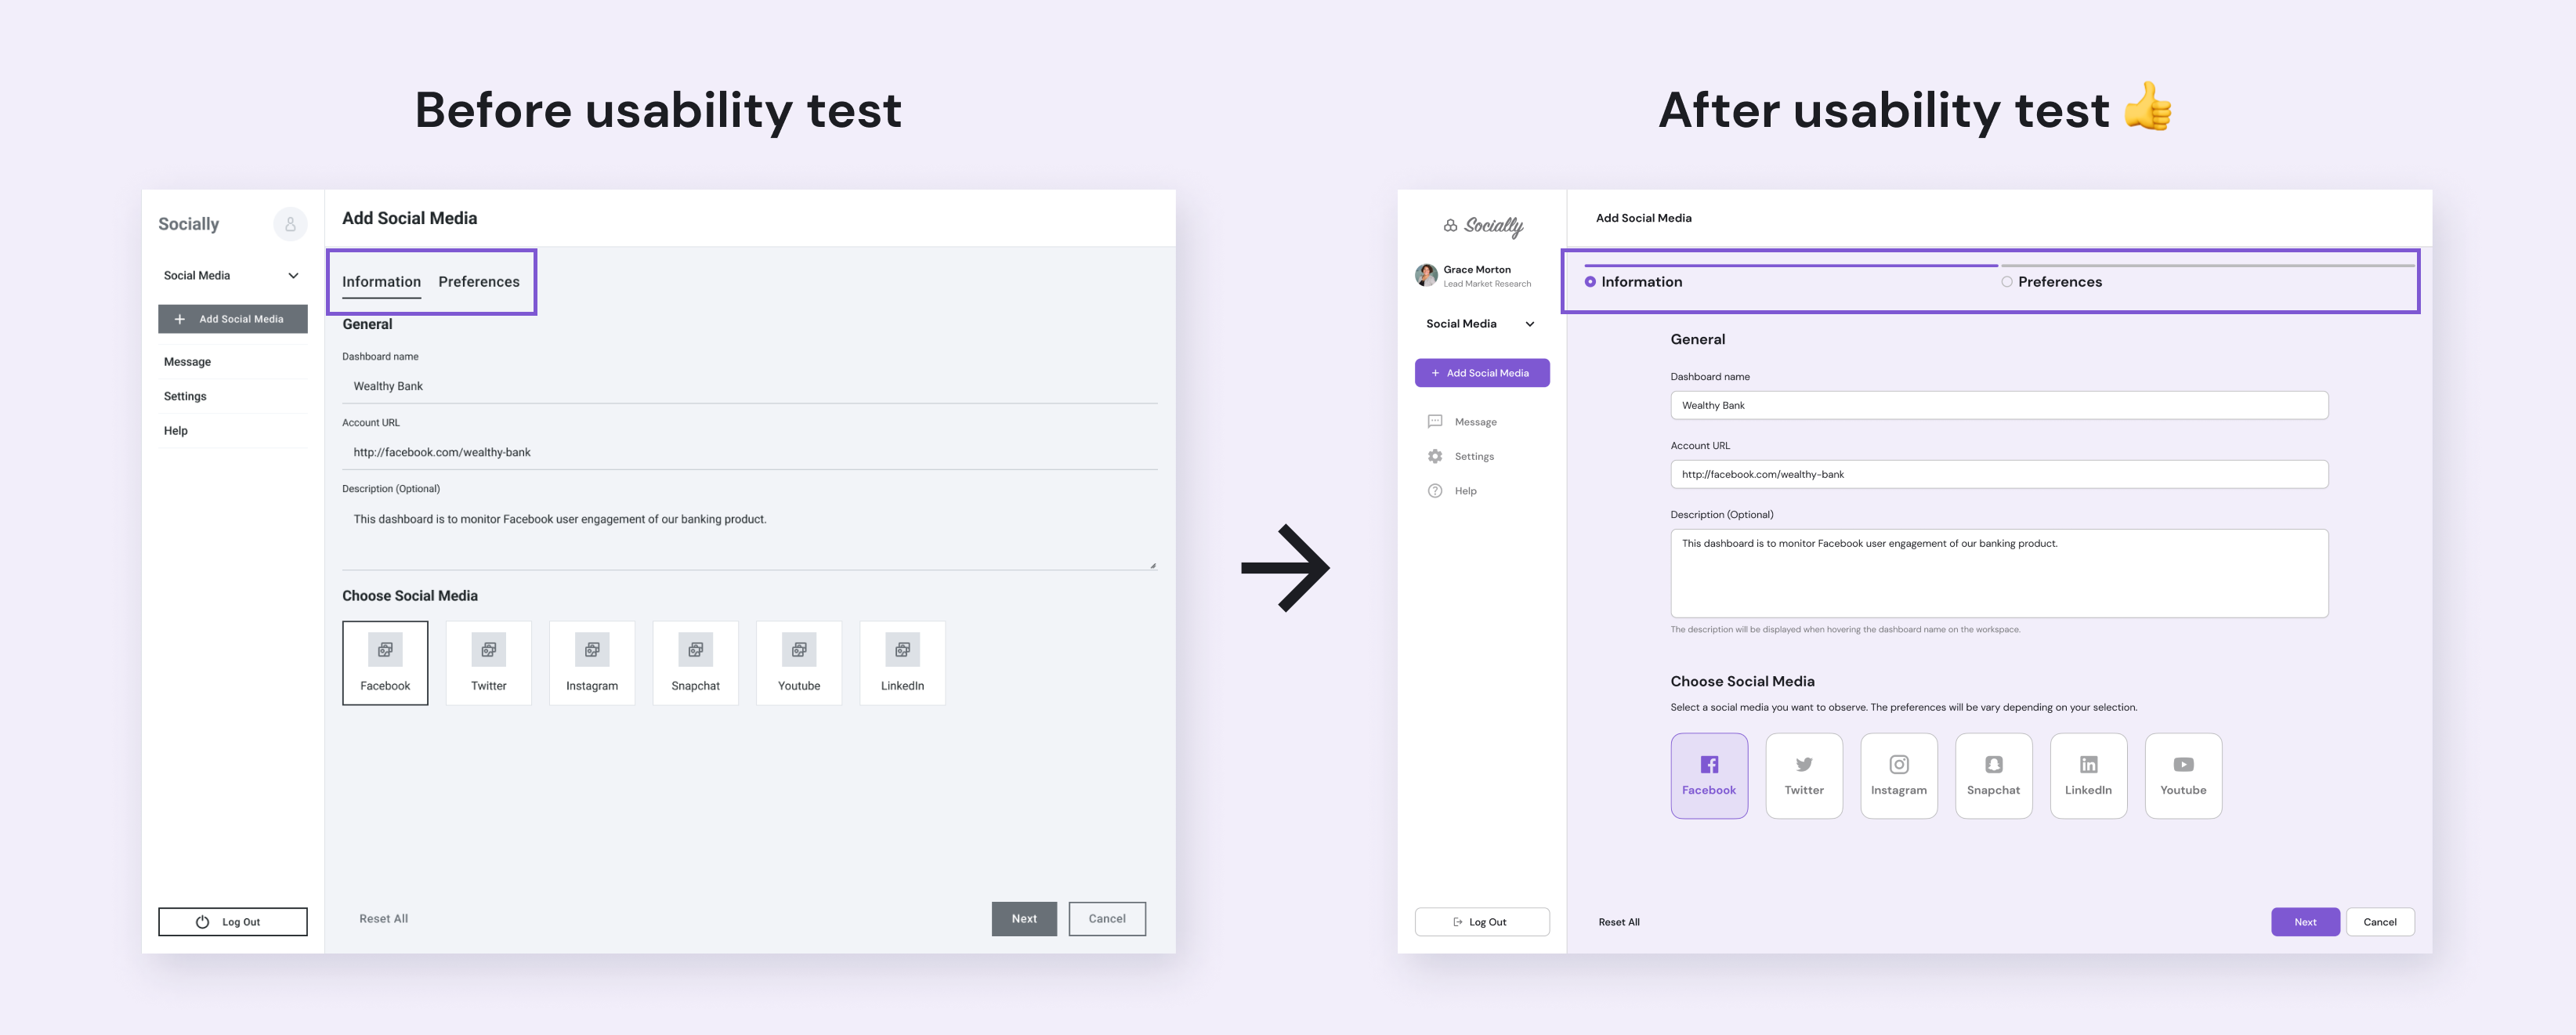
Navigation is a key. I made significant change here in the setup wizard. Users will have a clear step to follow, which the stepper is explained visually.
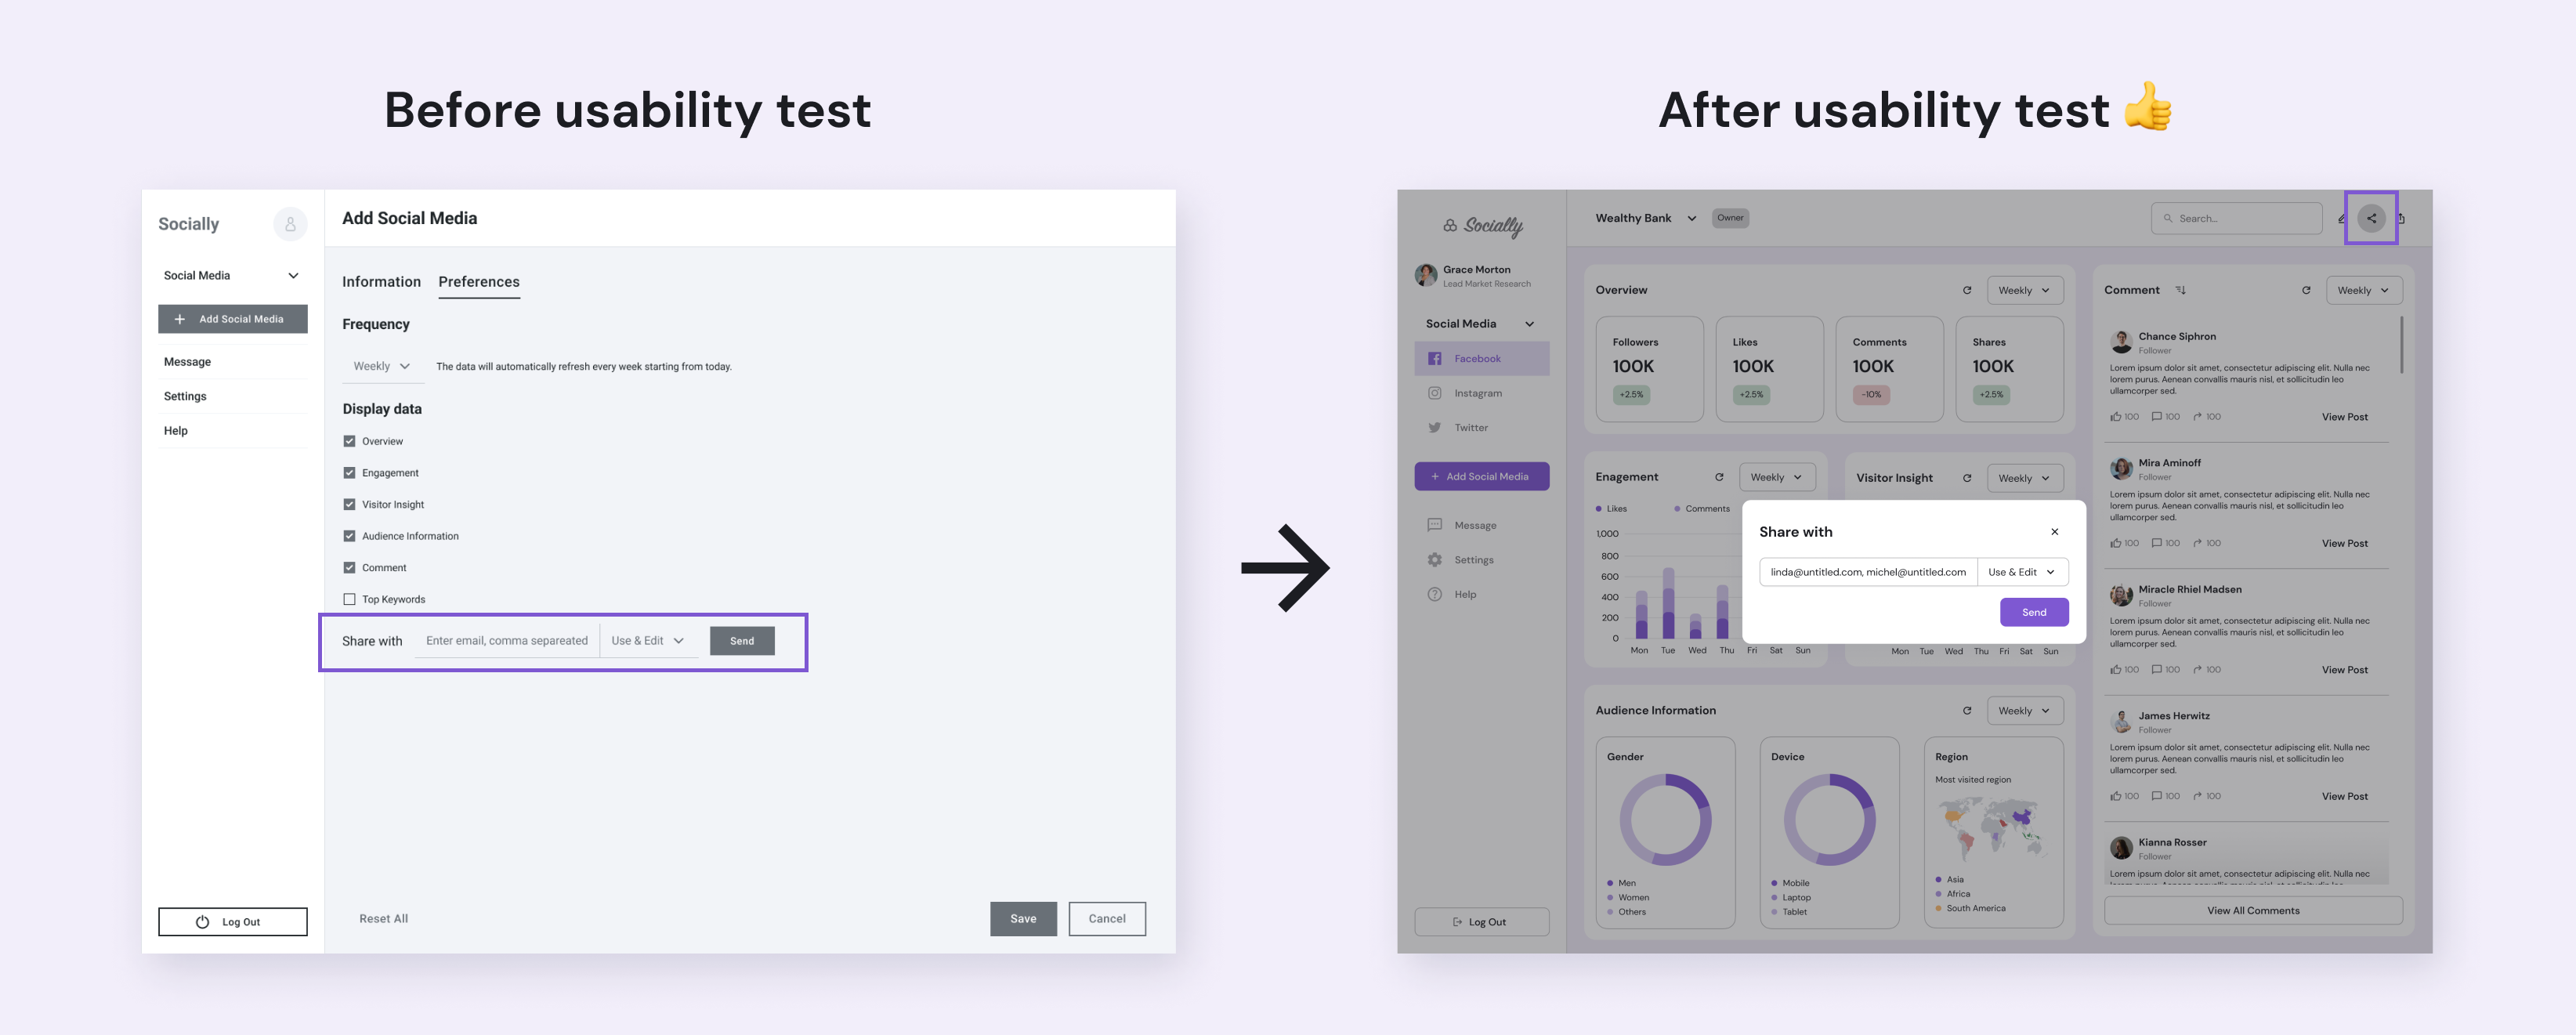
To avoid the confusion and conflict in the system, I removed the sharing dashboard option from the setup wizard. Users will only have the sharing option on the top bar of the dashboard.
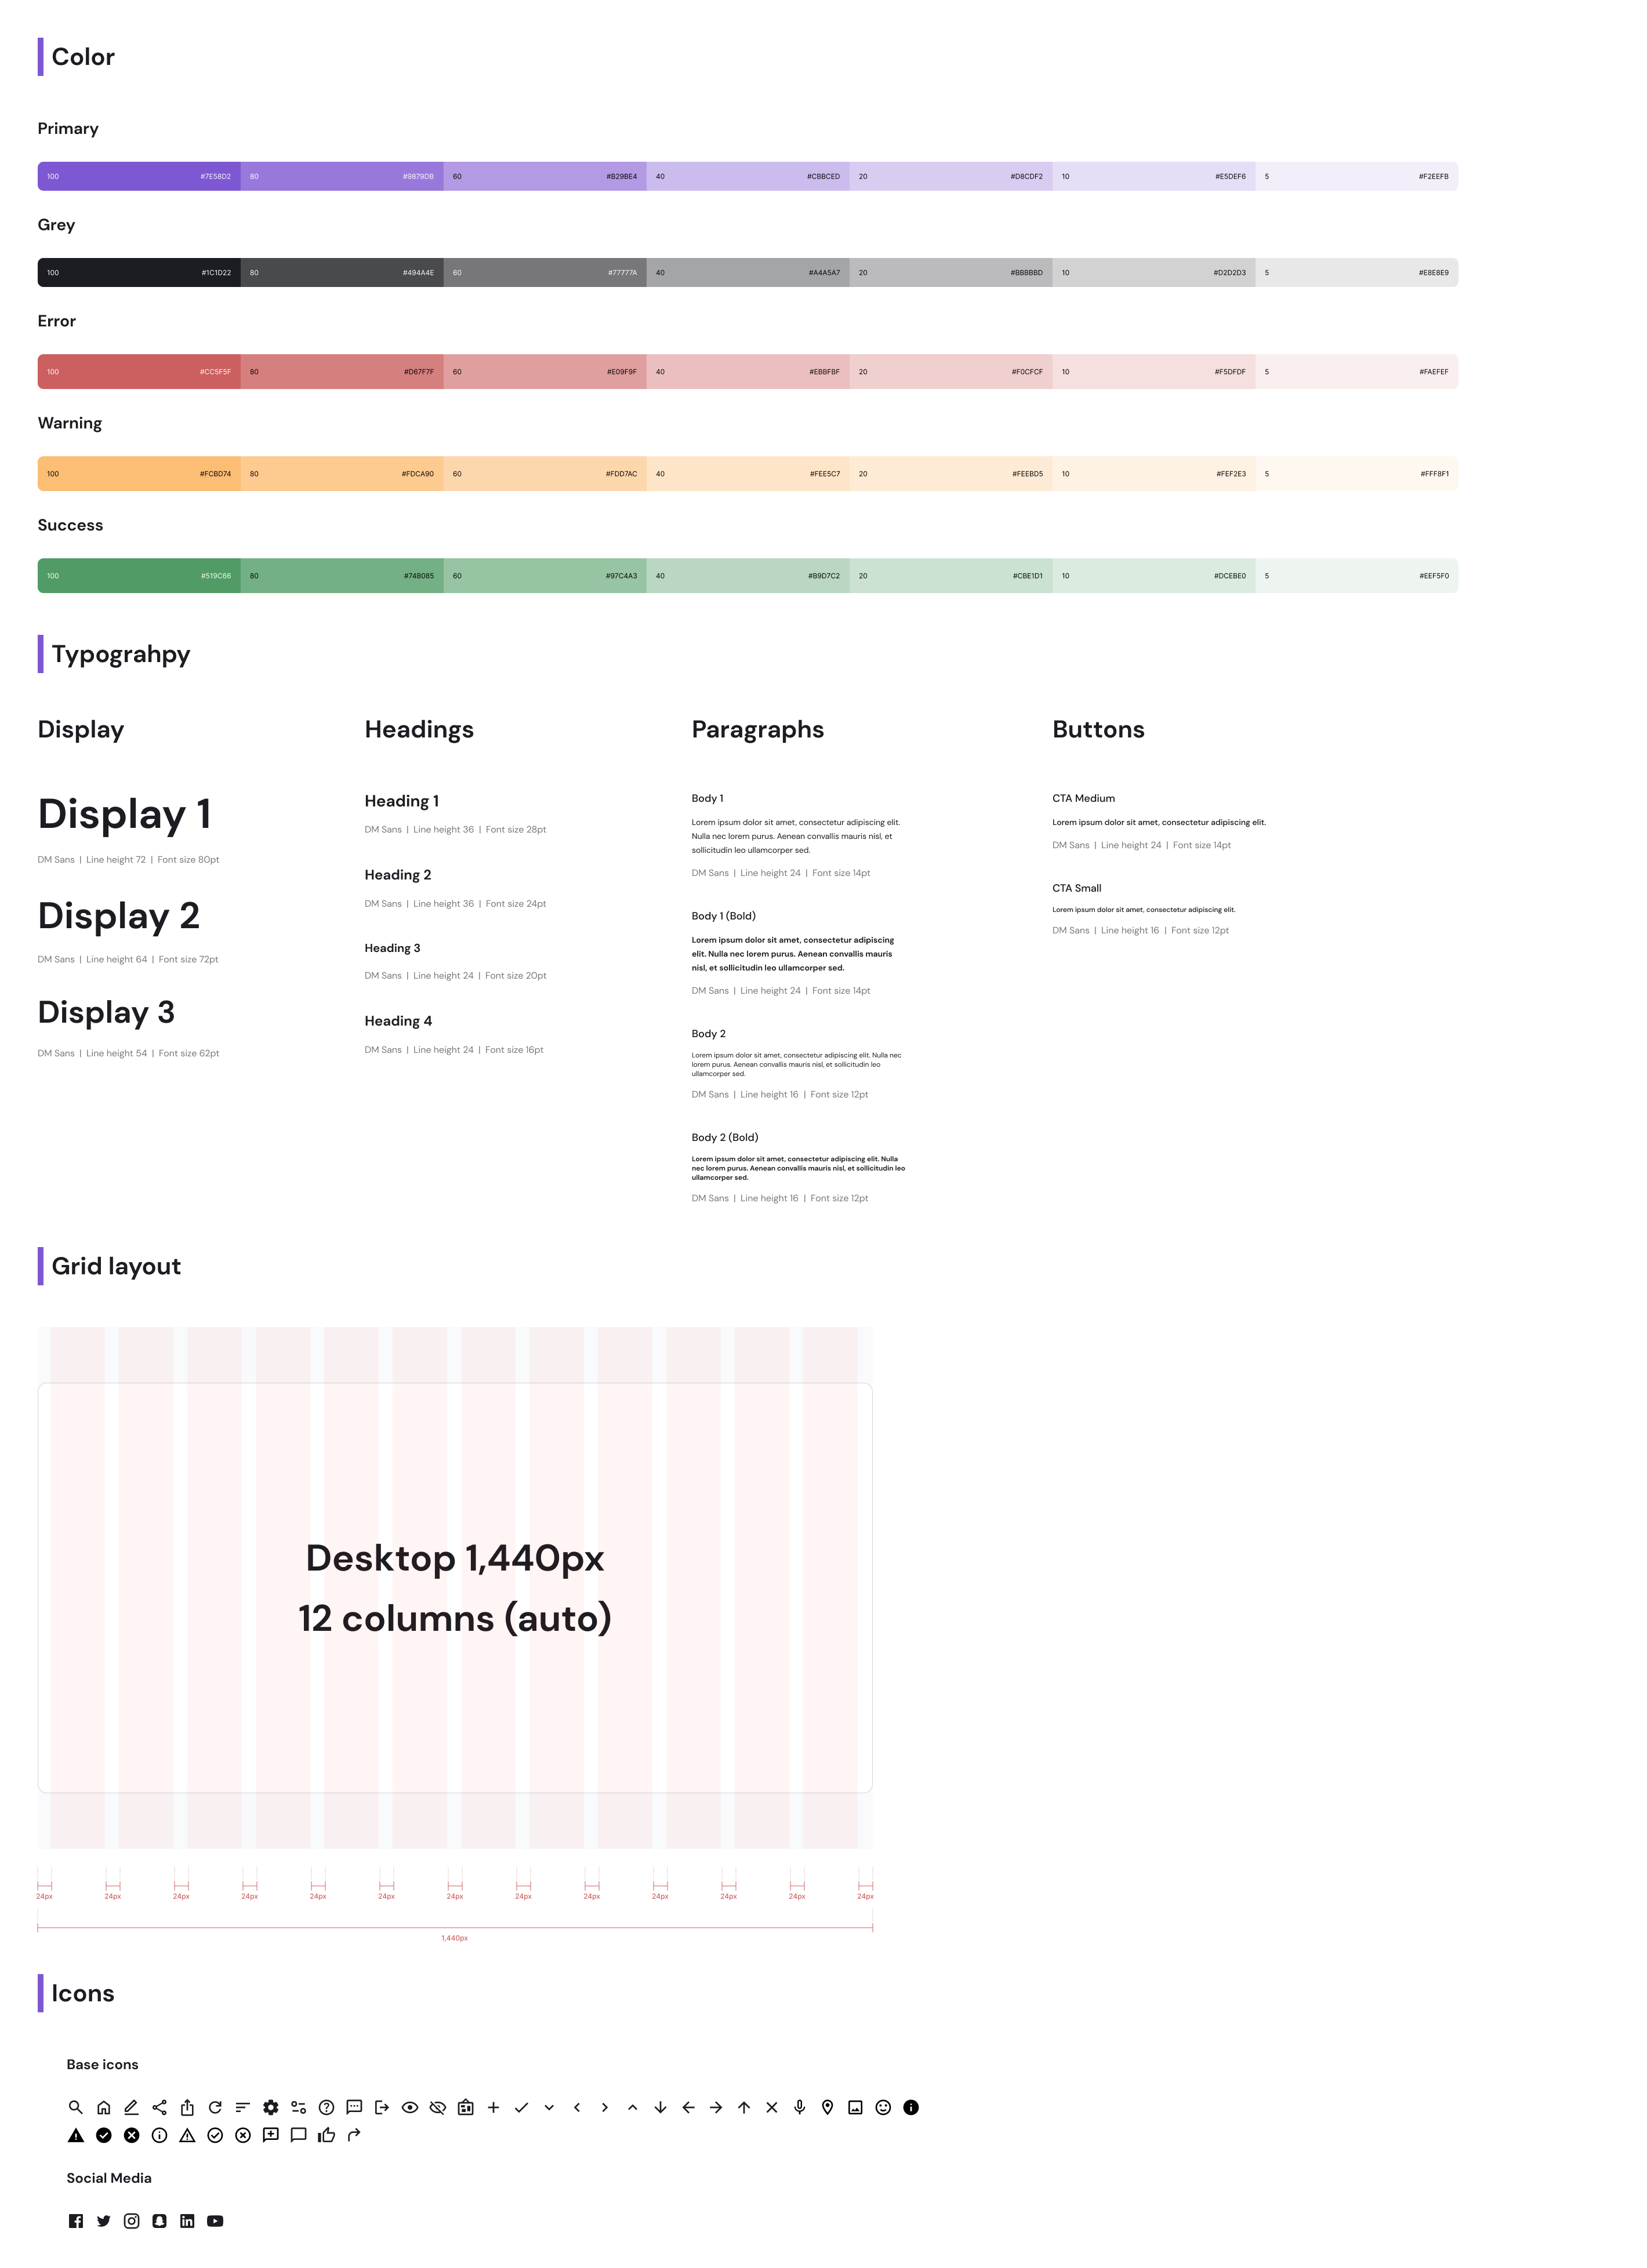
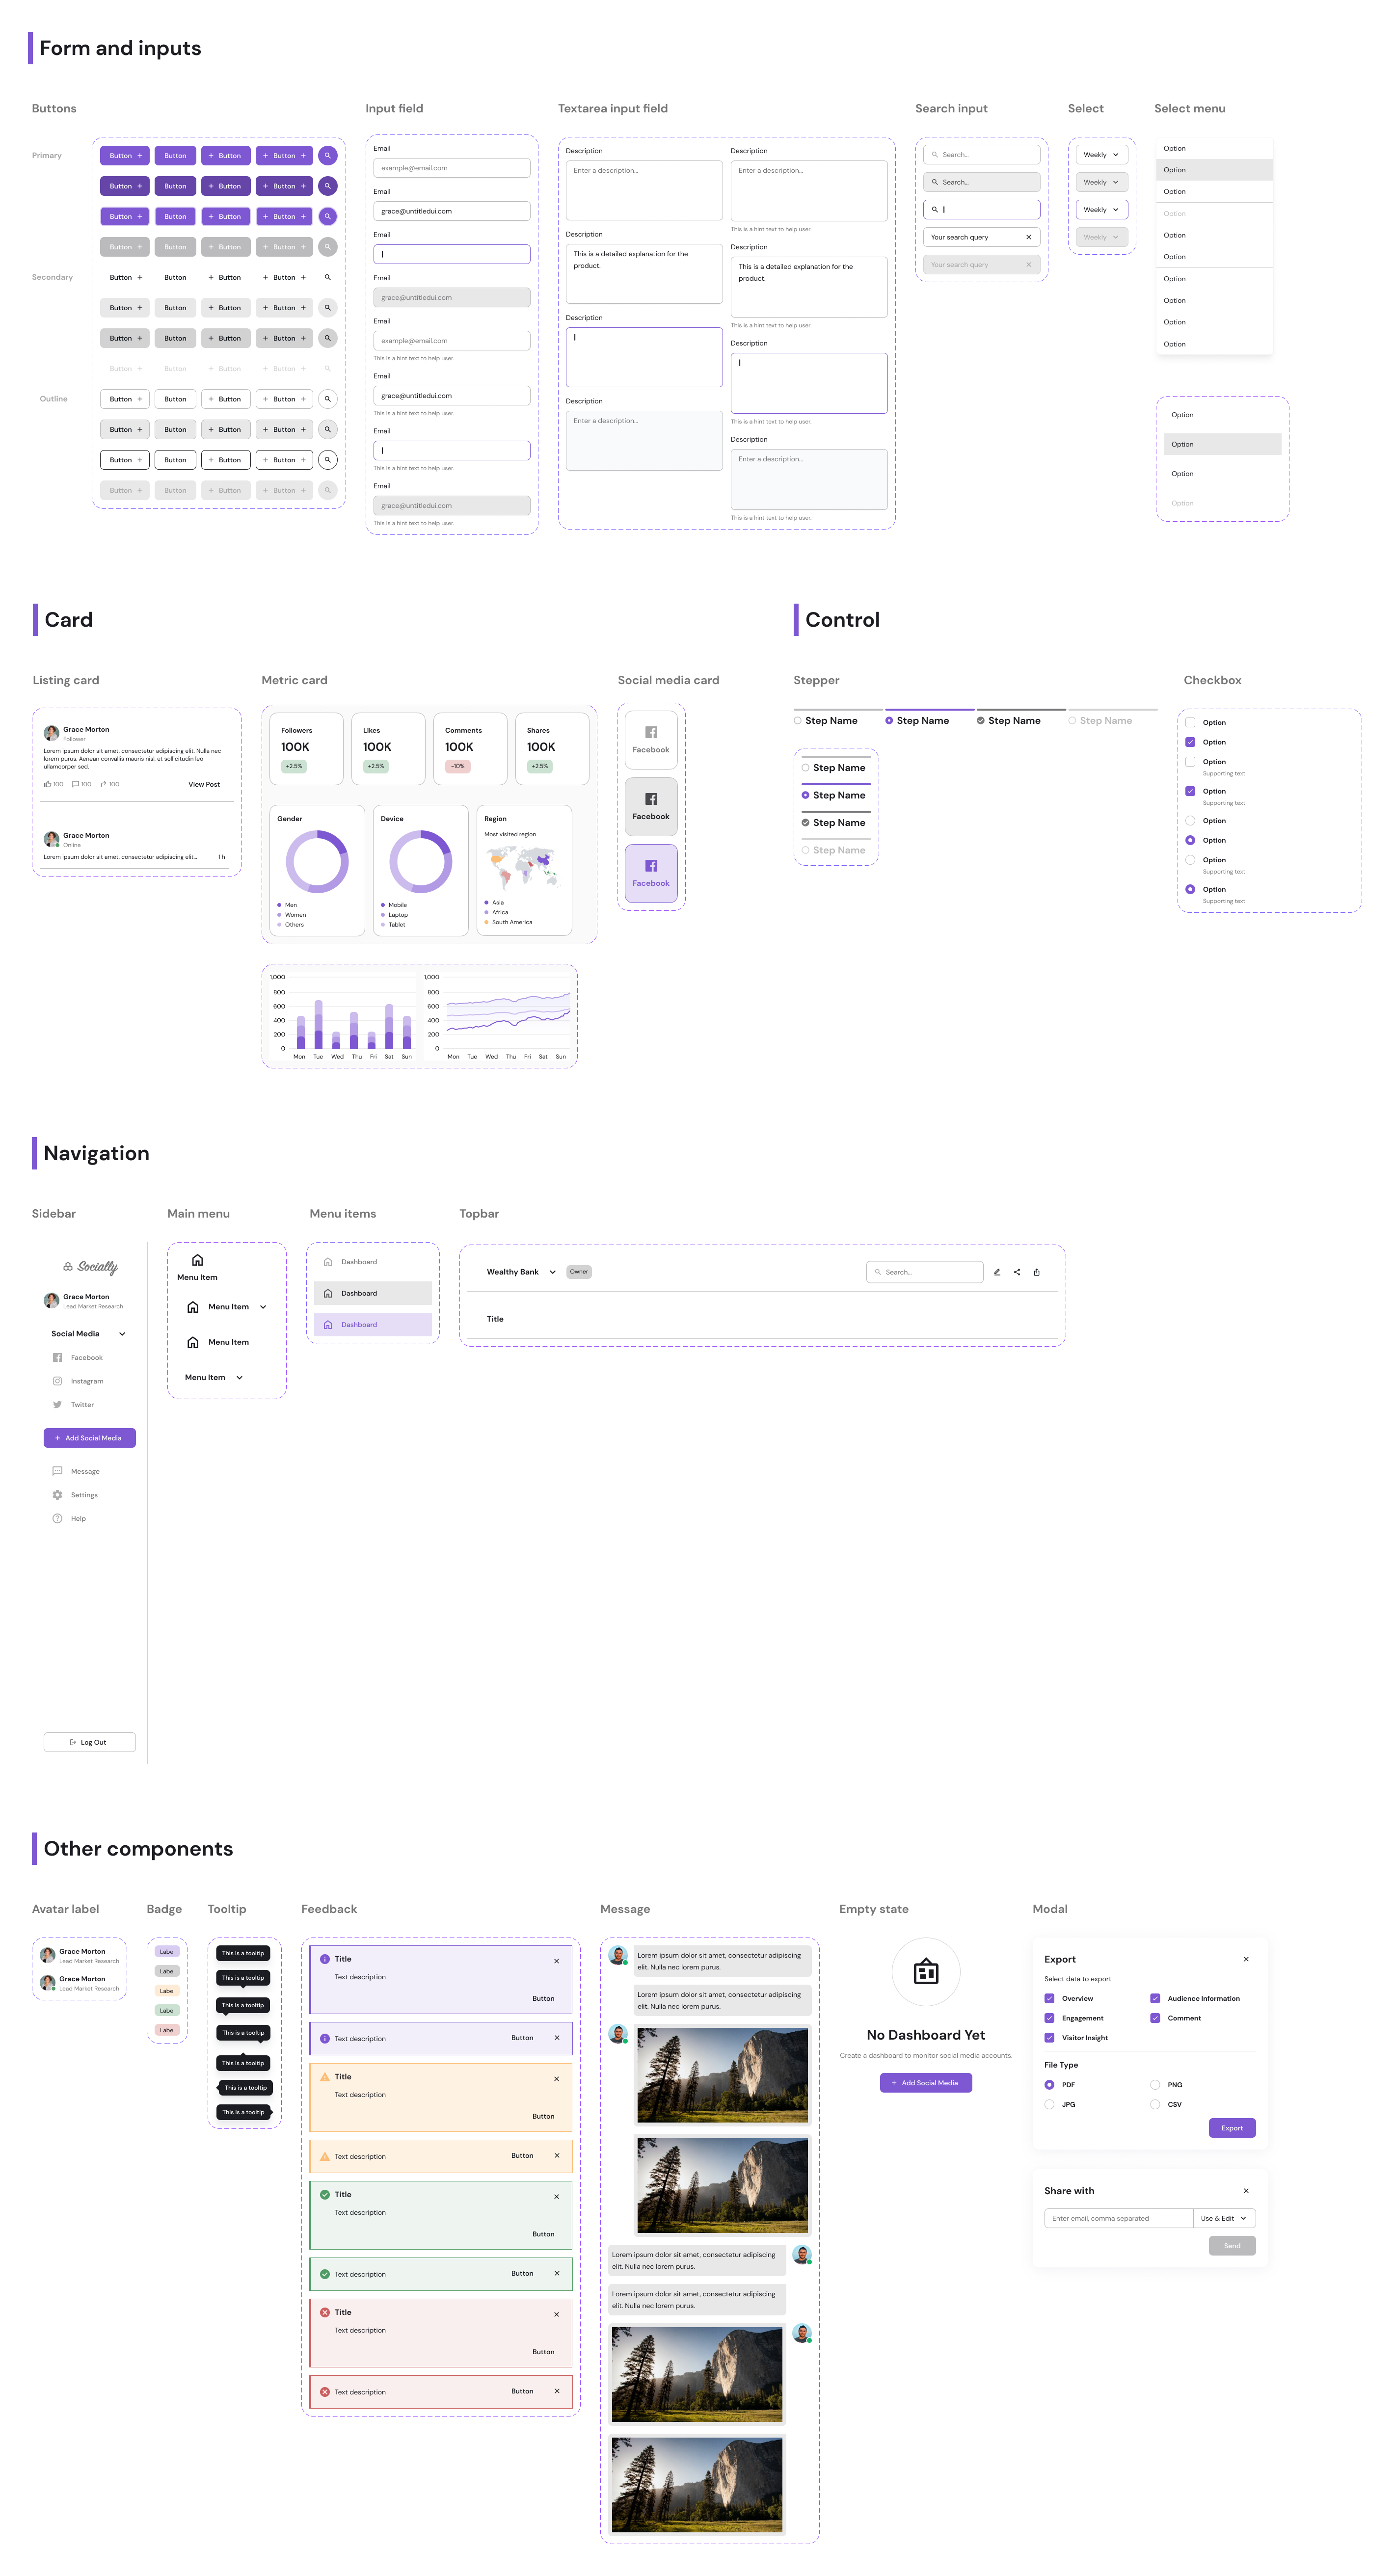
I created a design system to maintain consistency and standardized UI design. The visual style is modern and clean, including adding all the data visualization.
All of these elements finally come together in the final designs. Now it's time to start monitoring!
Easily adding new social media account to a dashboard with the customisable options. There’s the detailed explanation to guide users on every steps.
Users can share a dashboard to team members with different access. Invitees will receive a dashboard link by email. How convenient!

Allows users to continue the workflow by exporting dashboard data in the preferred format with a simple export modal.
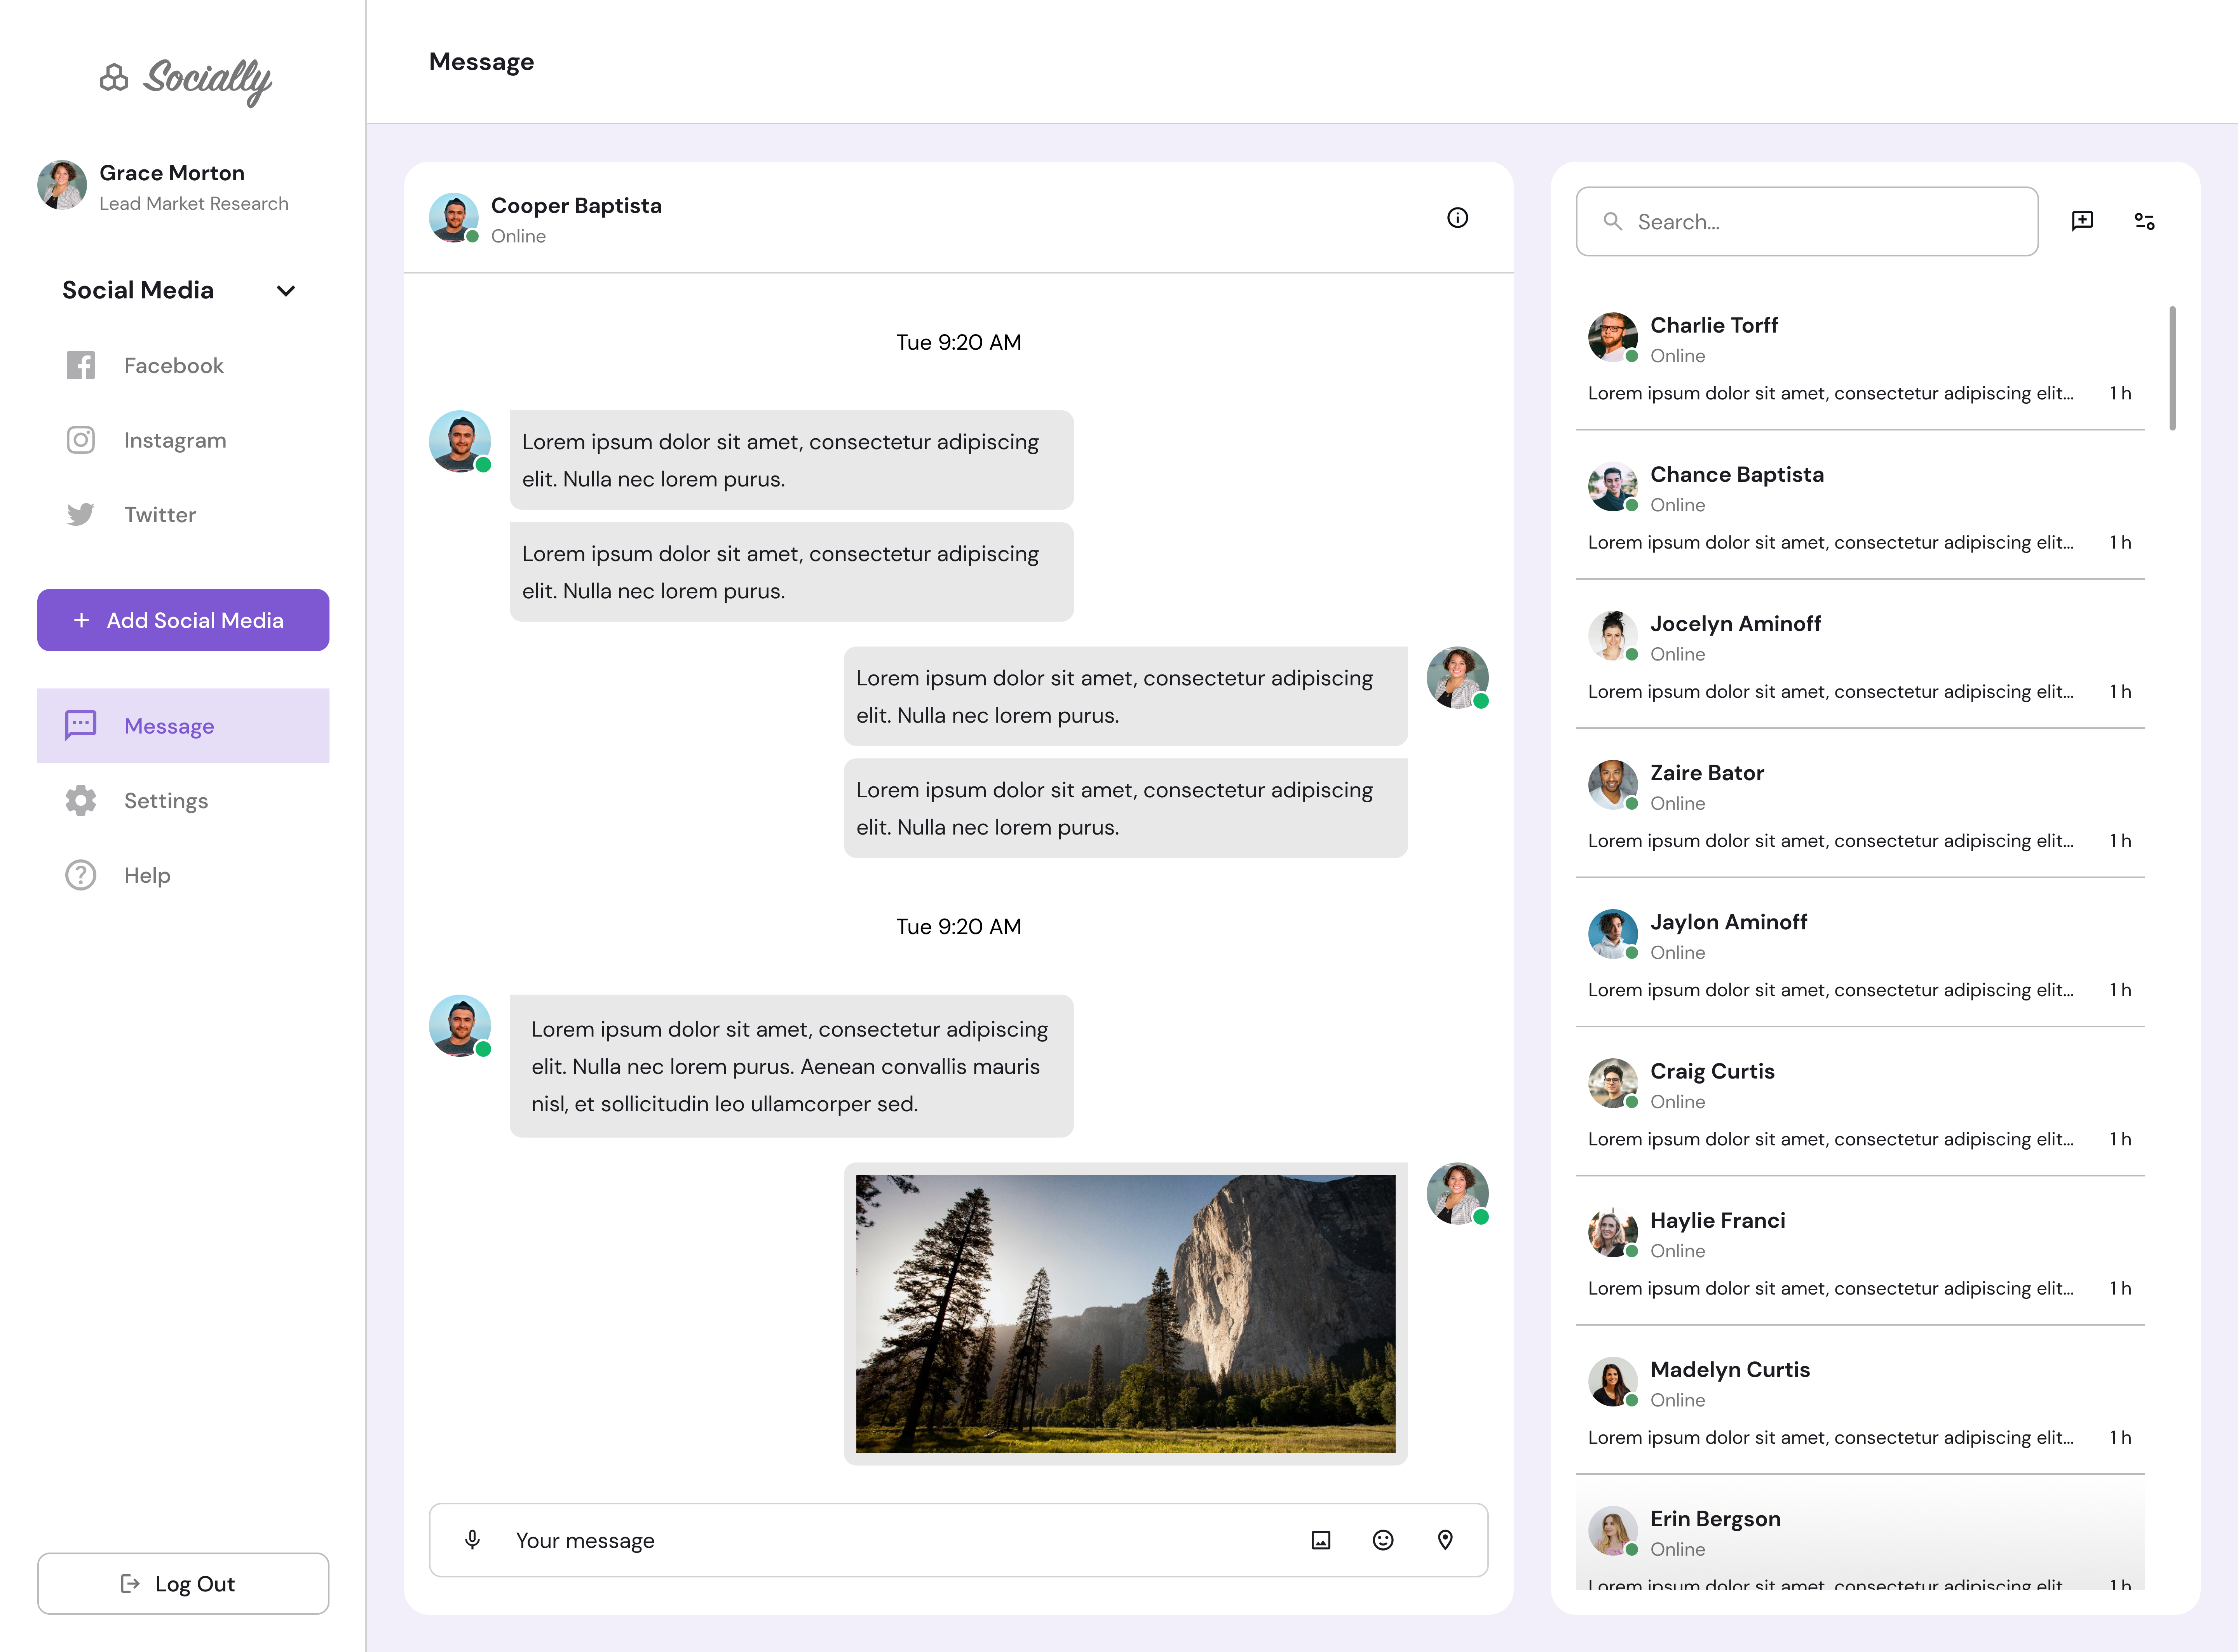
Allows team members to have real time communication through the message or chatroom on the platform.
I'll always have to keep in mind that "we are not users". Because when I was designing the product, I knew and understood how to use the product and its flow very well. And I let my thought influencing my work, I would like to keep my design simple. So, I decided to not add small details to the screen. And then it lacked of full functionality on those screens. After, I realized that I'm not a user! This product was not designed for me. Thanks to the design thinking process, which having the procedures to talk and listen to what users think and feel about the product. Therefore, the product is well designed in the right way for the right people.